Dark Art or the High End of Project Scheduling?
Dr. Frank Holzweissig, Technical Director, Germany and
Forough Mohammadi Delavari, Senior Consultant, Germany
Between contractual certainty and probabilistic reality
Contractually agreed completion dates create an illusion of control. They are fixed, enforceable, and often backed by liquidated damages or incentive mechanisms, yet they ignore a fundamental reality: projects do not evolve deterministically. When the promised date is missed and statistically, it often is, the consequences are immediate and severe: claims, penalties, loss of revenue, and damaged stakeholder relationships. What is commonly interpreted as a failure of execution is, in many cases, a failure of forecasting. The gap between contractual certainty and probabilistic reality is where delays escalate into disputes and projects slide into crisis.
Projects today face more pressure to meet deadlines and budgets. Across construction, infrastructure, energy, and IT, schedule overruns and cost escalations remain among the most frequent sources of conflict and financial loss. Traditional deterministic scheduling methods typically produce a single completion date, implicitly suggesting certainty, yet they provide no insight into the likelihood of actually achieving that date.
Because future conditions and events cannot be predicted with certainty, initial project duration and cost estimates are regularly exceeded as uncertainties and risks materialise. The central questions decision-makers should therefore ask are not whether a project will finish on time and within budget, but:
- What is the probability of meeting the contractual completion date and approved budget?
- Within which range might project duration and cost realistically vary?
- How likely are specific outcomes within that range?
This is where Schedule Risk Analysis (SRA), and its extended form Integrated Cost and Schedule Risk Analysis (ICSRA), become essential. These methods translate uncertainty and risk into quantifiable inputs, explicitly reflect their impact on schedules and budgets, and provide a statistically sound basis for informed decision-making. Rather than replacing deterministic schedules, SRA and ICSRA expose their limitations and make their implicit assumptions transparent.
In an environment characterised by growing complexity, tighter contractual frameworks, and heightened financial exposure, the application of SRA and ICSRA is no longer optional. It requires experienced planners with a solid understanding of probabilistic modelling, statistical principles, and several years of practical project experience. Familiarity with established methodologies and professional tools such as Safran Risk or @Risk is indispensable, as is the ability to interpret results correctly and translate them into actionable management decisions.
Risk versus uncertainty and the role of empirical data
It is essential to distinguish between the two concepts:
- Uncertainty describes the range of possible outcomes that arise from incomplete information. Example: An excavation usually takes 13 days, but may take only 10 under favourable conditions or up to 20 under poor ones. The duration is uncertain but not necessarily linked to a specific event.
- Risk refers to an identifiable event with a probability of less than 100% and a measurable impact. Example: “Rock layers are encountered during excavation” → Probability 15%, impact over 30 days and over €500,000.
Schedule Risk Analysis incorporates both perspectives: each activity or cost element is assessed for uncertainties in its estimates as well as potential risk events.
Uncertainties are modelled using three-point estimates (optimistic – most likely – pessimistic), while risks are defined by probability and impact parameters.
The quality of any analysis improves significantly when empirical data is incorporated alongside the expertise of the risk analyst:
- Weather records: Historical rainfall or frost days provide objective input for estimating weather-related delays.
- Delivery and logistics data: Past delivery times of key components yield realistic probability distributions.
- Project databases: Experience from comparable projects enables calibration of durations and risk events.
- Market and price indices: Variations in commodity prices or exchange rates are reflected in cost risk modelling.
This shows that risks and uncertainties are not a matter of intuition alone and they can be substantiated with data.
Typical project risks in practice
Although the range of potential project risks is broad, recurring patterns are observed across most industries:
- Technical risks: unexpected ground conditions, design or specification errors, interface conflicts
- Resource risks: shortage of key personnel, delayed material deliveries, subcontractor dependency
- External risks: extreme weather, permit delays, political decisions, fluctuating raw material prices
- Management risks: delayed decisions, unclear responsibilities, frequent scope changes
In most projects, only a few factors cause the majority of the overall risk, the so-called “Critical Few".
What is Schedule Risk Analysis?
Including Monte Carlo and Criticality
SRA replaces fixed assumptions in the project schedule with probability distributions and simulates potential outcomes.
Steps of an SRA
1. Model definition: A valid project schedule with tasks, dependencies, and
a. Milestones used as the foundation.
b. Random variables: Uncertainties are represented by probability distributions (typically three-point estimates). Risks are modelled as discrete events with probability and impact.
2. Risk mapping: Allocation of risks to activities or cost elements.
3. Correlations: Definition of relationships between risks, e.g. exchange rate and material cost may influence one another.
4. Monte Carlo simulation:
- The computer randomly draws values from defined distributions.
- For each draw, the critical path is recalculated and a completion date determined.
- Thousands of iterations create a distribution of potential project durations.
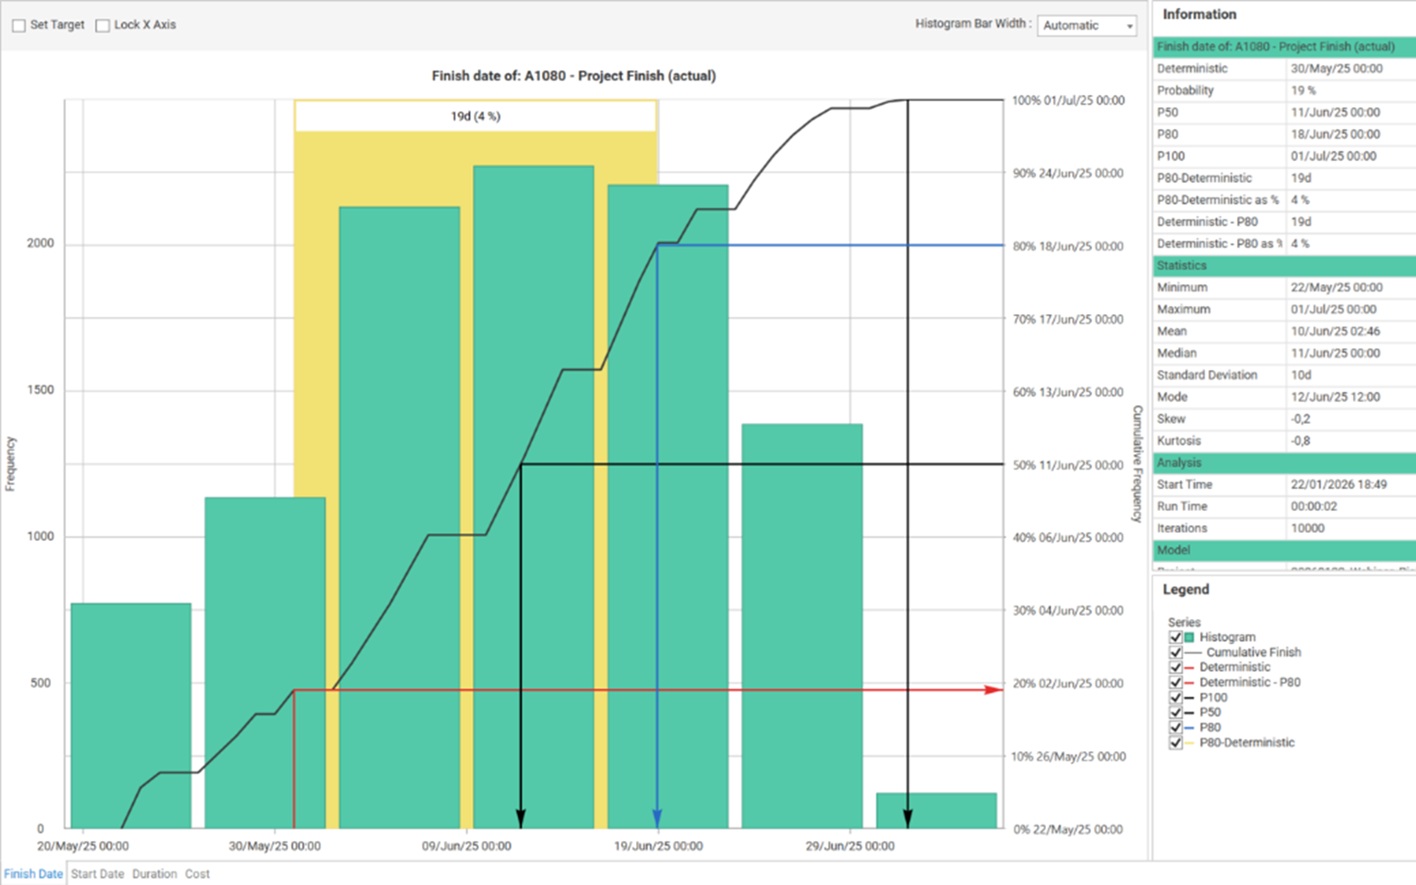
Figure 1: Monte Carlo Simulation Distribution showing P50 and P80 completion probabilities
Evaluation:
- P-dates (e.g. P50, P80) indicate the probability of achieving a certain completion date.
- Sensitivity analysis identifies which activities or risks have the greatest influence.
- Criticality Index (CI) measures how often an activity lies on the critical path across all simulations.
The Value of Criticality
The Criticality Index directs attention to the truly decisive activities:
- High-CI tasks are the main drivers of schedule overrun.
- Mitigation can be targeted where it yields the greatest effect.
- Combined with sensitivity results, the Critical Few become clearly visible.
- Within ICSRA, tasks with high schedule and cost risk are identifiable.
In short, the Criticality Index transforms complex simulation results into clear action priorities.
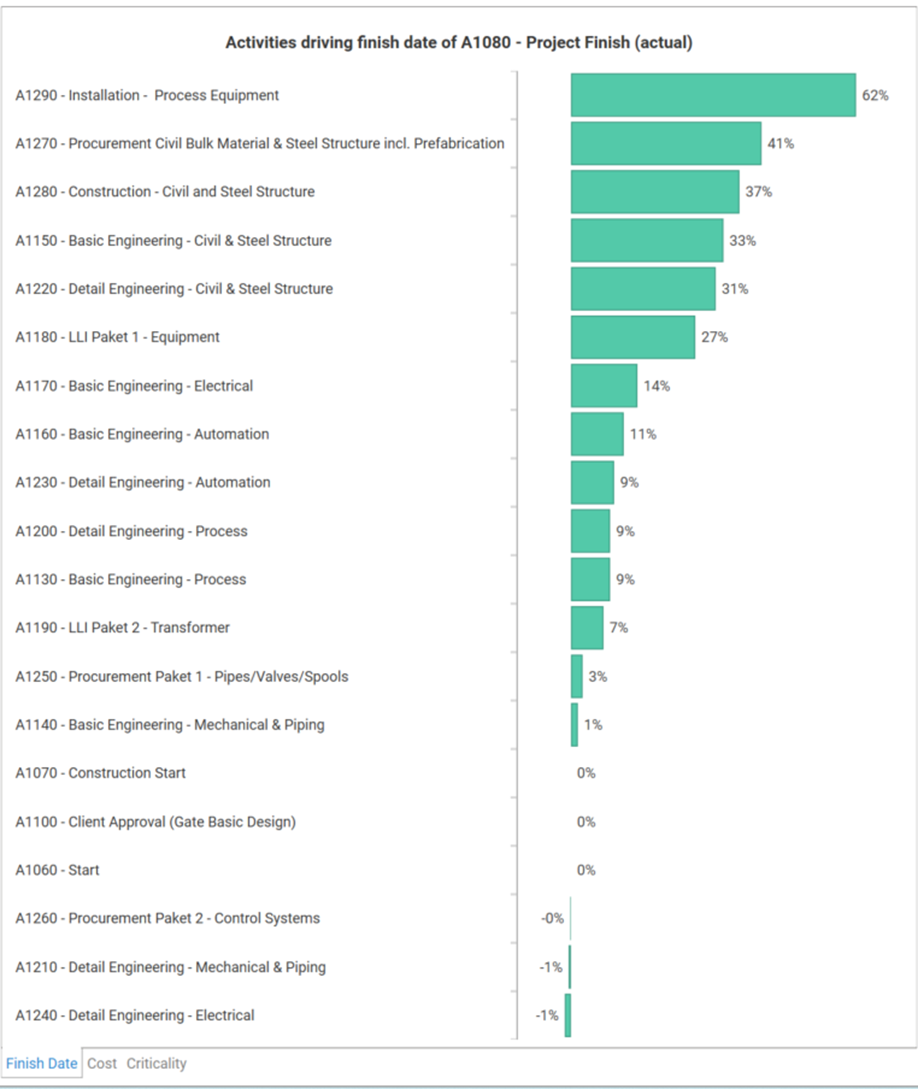
Figure 2: Tornado Chart showing risk driver drivers
Integrated Cost Schedule Risk Analysis
The next level
ICSRA links schedule and cost perspectives. Delays almost always lead to higher costs through site overheads, penalties, or lost revenue.
Example: A project section is delayed by three months, causing over €2 million in overheads and over €4 million in lost revenue. ICSRA visualises these relationships and enables realistic budget forecasts.
For investors, controllers, and project owners, the benefits are clear:
- Fewer cash-flow surprises
- Improved scenario comparability
- Informed decisions on whether preventive measures are economically justified
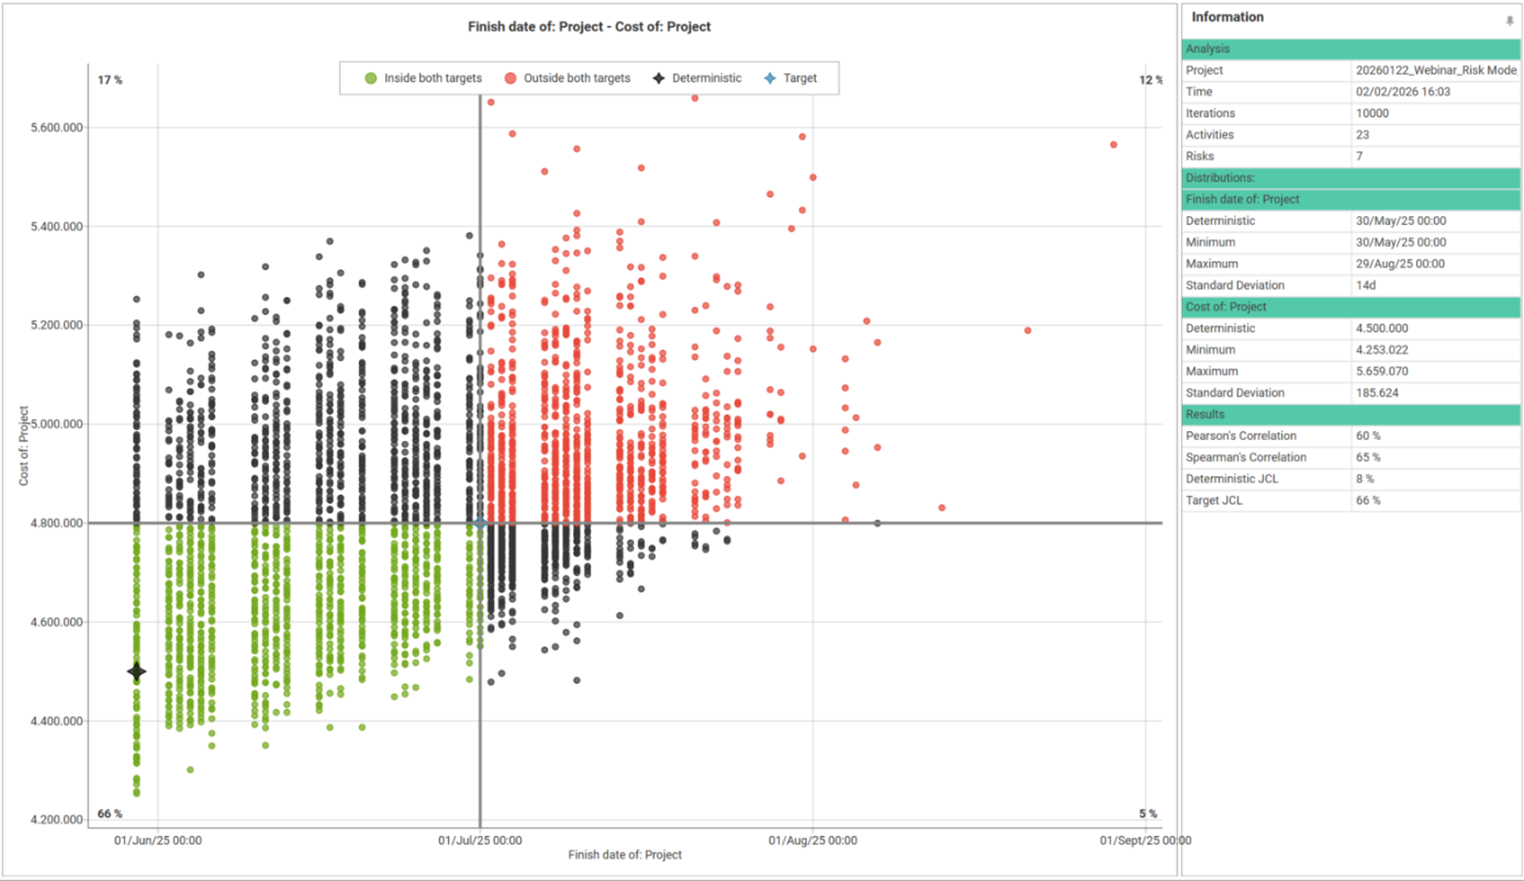
Figure 3: Correlation chart showing link between schedule delay and cost impact]
Practical example: from model to decision
- At the planning stage, an infrastructure project was scheduled deterministically for a duration of 30 months. Based on this plan, the project team initially believed that the contractual completion date could be achieved with only limited schedule contingency.
- However, concerns were raised regarding weather exposure and the reliability of key material deliveries. To better understand these uncertainties, a Schedule Risk Analysis was conducted, incorporating historical weather records and delivery performance data. The simulation revealed a significantly different picture:
P50 = completion at 34 months
P80 = completion at 38 months, indicating a low likelihood of meeting the original target date.
- Further analysis showed that three work packages accounted for approximately 75% of the total schedule risk (time overrun), highlighting a small number of critical drivers rather than widespread uncertainty across the schedule.
- Based on these findings, the project team evaluated mitigation options, including revised sequencing and the allocation of additional resources to the identified high-criticality activities. These measures were then incorporated into the model and the SRA was re-run. The updated results showed a substantial improvement, with the P80 completion date reduced to 32 months, albeit with an additional cost of €1.5 million.
- An Integrated Cost Schedule Risk Analysis demonstrated that this increase in cost was economically justified, as it remained well below the potential penalties and indirect losses associated with missing the contractual deadline. As a result, management approved the mitigation measures.
This example illustrates two key outcomes:
- Risk mitigation becomes quantifiable - allowing decision-makers to clearly assess which measures deliver the greatest benefit relative to their cost.
- Risk awareness increases naturally - project managers, controllers, and investors gain a clear and shared understanding of the true drivers of schedule and cost risk, enabling more confident and transparent decisions.
Conclusion and outlook
A qualified risk professional, working closely with the project team, identifies uncertainties and risks, quantifies them using appropriate methods, and integrates their effects into schedule and cost estimates. With accurate and informed interpretation of simulation outputs, this process establishes a robust foundation for credible decision-making.
SRA and ICSRA are not “dark arts” but robust, data-driven methods that support professional project management. They enhance transparency, improve forecast accuracy, and enable proactive project control.
A major advantage lies in their direct link to mitigation planning: results translate into actionable options, allowing teams to make fact-based decisions. At the same time, the process strengthens risk awareness across the project team so uncertainties are no longer ignored but openly discussed and addressed.
By using empirical data, Monte Carlo simulations, and indicators such as the Criticality Index, the true drivers of schedule and cost risks become visible.
For project managers, controllers, and investors, this means:
- Fewer surprises
- Clearer priorities
- Better decisions
Looking ahead, real-time data and AI will further refine accuracy but even today, one thing holds true:
Those who quantify risk manage projects more successfully.
This article was originally written for issue 30 of the Diales Digest. You can view the publication here: https://www.diales.com/diales-digest-issue-30