AI technology, BIG data and schedule analytics
David Pritchard - Senior Consultant, Driver Trett Singapore asks whether Driver Trett should plunge into the ‘BIG’ data trend? Do we have the right talent and knowledge to move us into the future?
Bill Gates once said: “Information technology and business are becoming inextricably interwoven. I don’t think anybody can talk meaningfully about one without talking about the other”. Whichever department you work in, or whatever interests you may have, it is inevitable in today’s market that you will come across a story on how ‘data’ is changing the face of business. While it could be using data to increase revenue through efficiency, or adding additional revenue streams, or using business intelligence tools to accurately predict forecasting; data should not intimidate the user, but should be utilised to create informative data visuals and accurately produce results, to gain leverage in today’s competitive markets.
Data is integral to our work and how we manage this affects how we conduct our day-to-day business activities and subsequent work flow. The Singapore data team has found great success in efficiently processing large quantities of data to support and enhance delay analysis. Under the management and guidance of John Lancaster and myself, the data team have successfully solved a number of complex problems, using a wide range of applications.
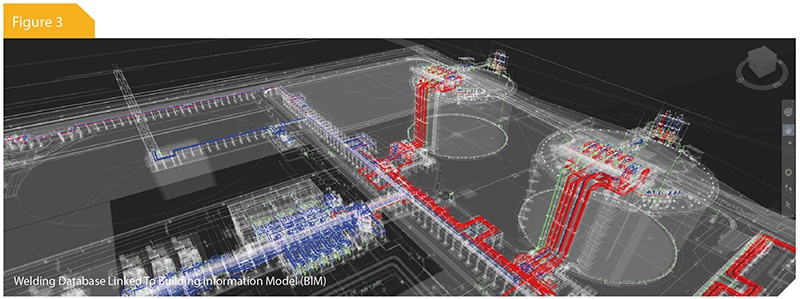
Some of the challenges the team encountered range from extracting significant volumes of data to linking welding databases into 3D models. They have derived certain solutions to complex problems, including writing comprehensive programming to automate the link to 3D models; or using bespoke tools, such as an in-house application which interrogates the structured query language (SQL) database of Primavera planning software. These solutions will allow the end user to generate schedule reports which can be used to supplement the delay analysis.
Large volume of documents from the clients
Currently, Driver Trett have approximately 45 servers worldwide, storing somewhere in the region of 45 terabytes¹ (TB) of data. Considering that 1TB is generally estimated to contain 75 million pages, it is becoming more apparent of late that the volume of project documentation received from our clients is growing from previous years.
For example, one of our recent projects required the interrogation of around 2TB of data. Digestion and interpretation of vast quantities of information within the client’s timeframes (whether it be for a claim submission or an expert report) is a challenge for most, if not all, consultancies and their respective teams. The data team have found the answers to automating a number of processes.
As an example, a typical process that the team manage is the extraction of data from daily progress reports, which is usually from a number of sources, not to mention differing formats. The use of daily progress reports is an important part of the assessment, as it often provides important information regarding what actually happened during the project lifespan.
Let’s say a hypothetical project spans over three years, this equates to the extraction of approximately 720 documents for a productivity study, and possibly many more if there are multiple subcontractors. This would create literally tens of thousands of records to be captured. If analysis of the 720 documents in question were completed manually by a delay analyst, it would likely take several weeks (or possibly months) to perform and could be prone to human error. The data team has been able to streamline this process, requiring approximately 1-2 days to write the relevant code and then a further 2-3 days to capture data from many different formats of reports. When the data is extracted, it is populated into a database (allowing for ease of data management) where team members can access the data via the server to perform their respective analyses. In total, the automated process may take around 4-5 workings days.
Schedule analytics
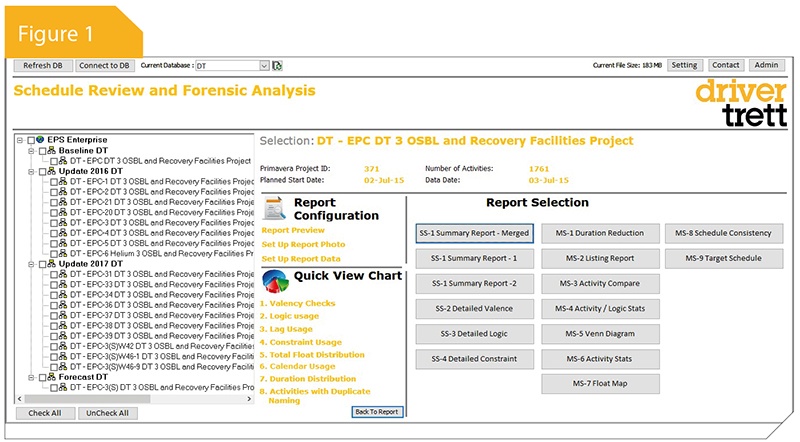
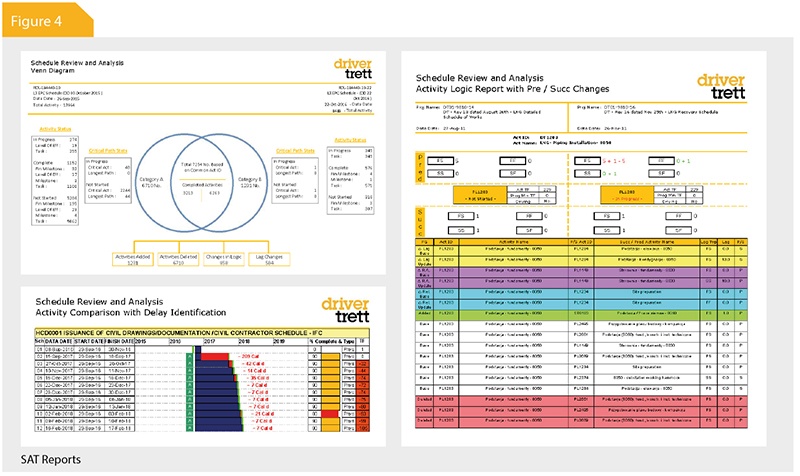
The data team have been developing a reporting system for the efficient analysis of Primavera schedules. They have now developed a fully-functioning application called the schedule analytics tool (SAT). This offers a suite of reports which allows the user to analyse multiple schedules simultaneously, as well as generating analyses at the click of a button.
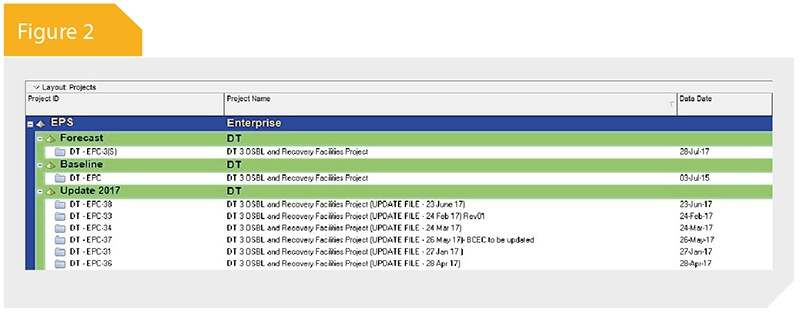
The SAT has been designed to be user friendly, having a straightforward interface (see Figure 1). The tree-view structure shown in Figure 2 indicates that, when selecting reports, it mirrors the same structure as the Primavera enterprise project structure (EPS) created by the user.
Users can intuitively toggle between high-level schedule analysis, or dig down into the detailed activity levels and analyse the data via a powerful filter option. When it comes to sharing the results, users are able to export the chosen data into a PDF format file. Additionally, as further analysis might be required using the same data, the SAT has an enabled property function to export the raw data into a MS Excel workbook, putting it into a format which allows the user to create their bespoke graphs and reports.
4D modelling
The data team have been looking at ways to utilise 3D Navisworks² (NWD) models other than using it for taking two-dimensional (2D) snapshots. The data team have developed effective ways to identify equipment, pipe-lines and various other properties within the 3D model, using programming code such as hypertext mark-up language (HTML) and visual basic application (VBA). This then allows the user to feed data into the backend of Navisworks and, as a result of this process, a 4D model can be re-created using site records showing exactly the sequence of works, as recorded in the data.
Traditional building design was largely reliant upon 2D technical drawings whereas, in recent years, building information modelling (BIM) is now becoming the norm. With the implementation of BIM, the data model can be augmented beyond the three primary spatial dimensions by including time as the fourth dimension, known as 4D modelling, and cost as the fifth dimension known as 5D modelling. This has gained traction in the construction industry and, in 2016, was valued at approximately USD 3,976.6 million and was forecast to grow at a compound annual growth rate (CAGR) of 19.3%³ from 2017 to 2025. BIM is also proving to be a beneficial tool in alternative dispute resolution (ADR). For instance, delay experts have been presenting 4D models to tribunals to visually demonstrate how delay events have impacted the sequence of construction works.
As is commonly understood, outsourcing tasks like this can be expensive. The team have investigated and innovated what they consider to be the best ways to link schedules and project data into the 3D models. This removes the tedious manual selection process, where the user has to manually select and group items in the model, to the activities in the schedule. By automating this process, they have substantially reduced the time to perform these tasks. Furthermore, a tool has been developed to import data directly and efficiently into Navisworks, allowing the creation of a 4D simulation; whereby information provided by the client, along with schedule data, can be linked to the model by means of automation.
The future
Genetic Algorithm
Due to the complex nature of the projects that Driver Trett work on, there are often a number of possible sequences in the schedules linking execution of the works. Each of these sequences represents a different methodology for execution, or may be a subtler reconfiguration. Typically, when a set of activities are re-sequenced, the schedule should likely yield a different project completion date or a different profile of resource usage. With artificial intelligence (AI) now making its way into all industries, the academic community have been applying evolutionary algorithms to resource constrained project scheduling problems. As a result, the most optimal solutions are being generated, as these algorithms have proven to give better solutions than conventional planning software. The data team are currently testing these algorithms on Primavera data and generating optimised resource schedules.
Artificial Neural Network
Successful data extraction is achieved from files in native excel formats. However, this does present a challenge; as certain files in PDF formats cannot be successfully converted using conventional optical character recognition (OCR) software. To solve this, the team has started developing its own OCR model using Python and C++ code. The model has so far achieved a 60% accuracy. However, this will improve with the implementation of AI techniques such as neural networks and deploying various algorithms such as Camshift algorithms, which will differentiate and separate tabular data from normal text. The model will then undergo supervised learning, allowing it to make decisions based on previous results. Once the model performs as expected, the team will start additional model training; where the model will soon read hand-written reports such as site daily diaries, etc. This will allow the analysts to search documents in a structured dataset, which may be used for further analysis.
Moving Forward
Given the current results, and the large quantities of data that the team are working with, there is a potential and an opportunity to take Driver Trett and its clients into the future and ensure they remain at the forefront of the industry.
1 A terabyte is more precisely defined as 1,024 gigabytes (GB)
2 Used primarily in construction industries to complement 3D design packages (such as Autodesk Revit, AutoCAD, and MicroStation) Navisworks allows users to open and combine 3D models, navigate around them in real-time and review the model using a set of tools including comments, redlining, viewpoint, and measurements. A selection of plug-ins enhances the package adding interference detection, 4D time simulation, photorealistic rendering and PDF-like publishing
3 https://www.businesswire.com/news/home/20180323005419/en/Global-Building-Information-Modeling-BIM-Market-2017-2025